Server monitor
In plain words
Section titled “In plain words”Server monitor shows how your saved servers are doing without opening a terminal on each one: CPU, memory, swap, disk, load, uptime, latency and temperature. Each host gets a status from limits you set, Healthy, Warning or Critical, or Can’t check with the reason, so one look tells you which server needs attention.
With Background monitoring on, ZestSSH signs in to the hosts you choose and checks them every few minutes, and can tell you when one runs high. The free plan watches up to 5 hosts; Squeezed watches any number.
Set it up
Section titled “Set it up”On a computer
Section titled “On a computer”-
Open Server monitor in the side rail, under Utilities. Where it says “Background monitoring is off”, choose Turn on monitoring.
-
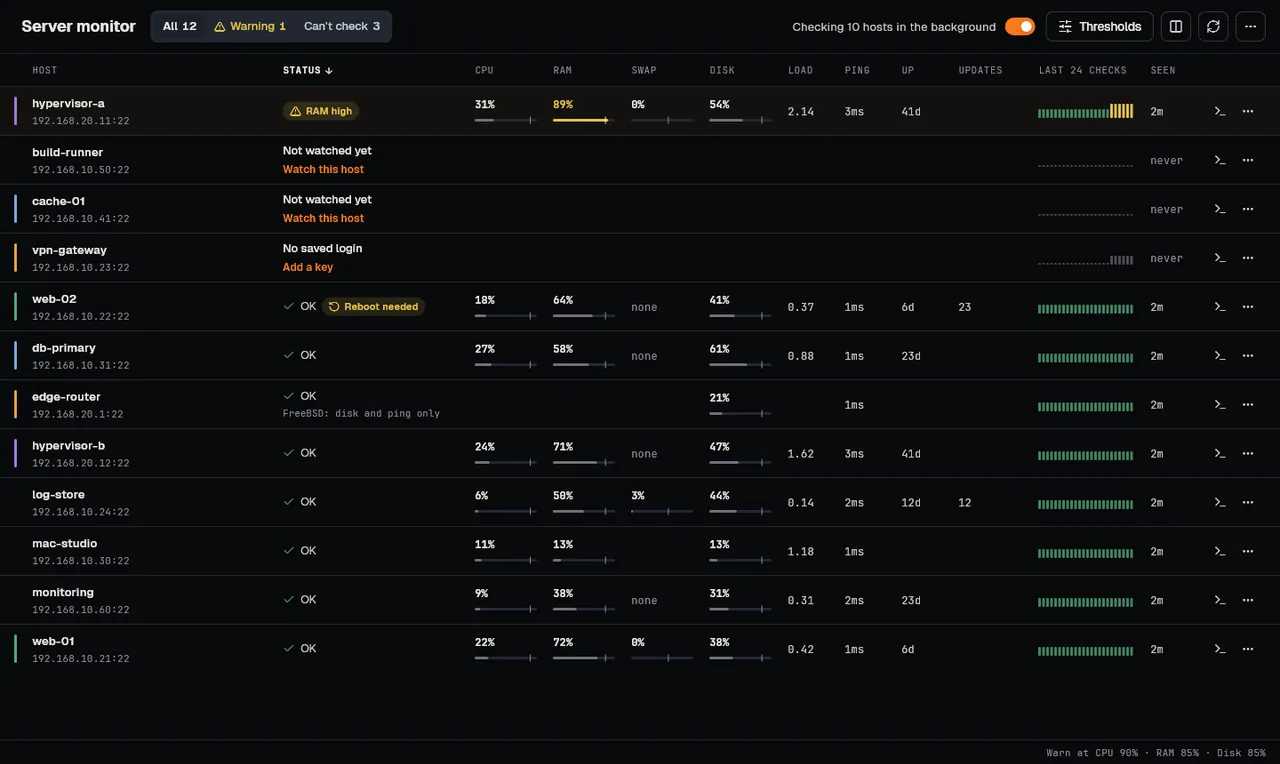
Choose Choose servers (also Choose hosts to watch in More options) and tick the SSH hosts to check. A row that says Not watched yet has Watch this host too.
-
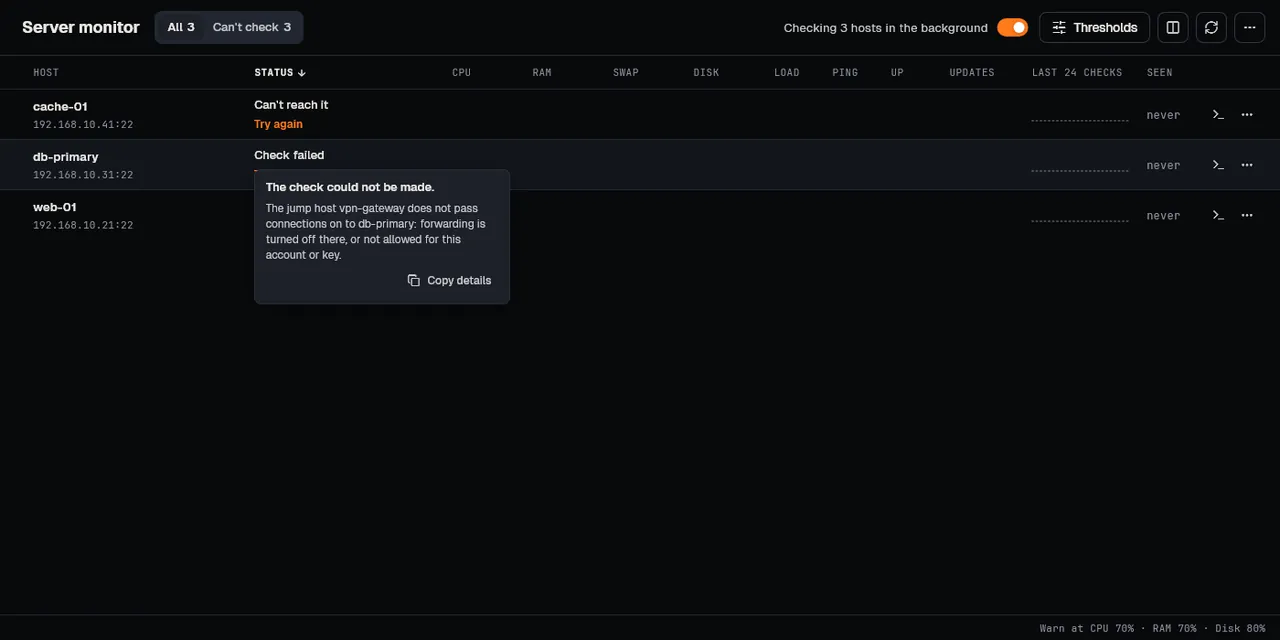
Read the Status column: OK, the metric over its limit (for example RAM high), or why the host cannot be checked, with the fix beside it, such as Add a key, Try again or Review the key. Point at it for the full cause and Copy details.
-
Click Thresholds to set Warn and Crit for each metric, for All hosts or Per host, how often to check (Every) and how many checks in a row change a status (Change after).
-
To be told when a host goes wrong, turn on Monitor alerts in Settings, under Notifications.
On a phone or tablet
Section titled “On a phone or tablet”-
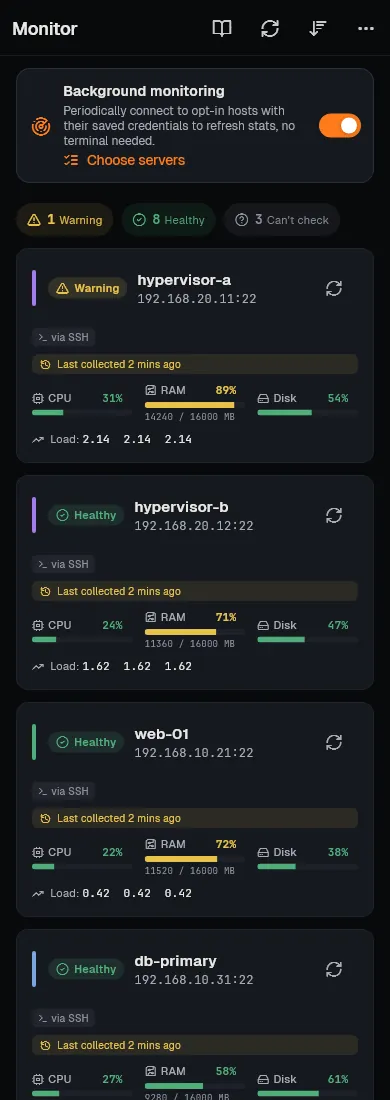
Open the Monitor tab. Turn on Background monitoring and tap Choose servers. You can also long-press a host on the Hosts tab and choose Monitor in background.
-
Tap a card for the host’s details. Tap Warning, Healthy or Can’t check at the top to show only those hosts; Sort & filter sorts them.
-
Thresholds and Data source are in the menu at the top right. For notices, turn on Resource alerts in Settings, under Notifications.
How it works
Section titled “How it works”- Over SSH, with a connection kept open. Each watched host is signed in to once with its saved key or password and stays connected. At each check ZestSSH runs short read-only commands (for example
head -n 1 /proc/stat,cat /proc/loadavg,free -m,df -h /;top,vm_statandsysctlon macOS), each with a 5-second limit. It never forwards your SSH agent and never restarts a host; Reboot needed only reports/var/run/reboot-required. See Server monitor. - It does not hammer a host that will refuse it. A host that refuses the sign-in, or whose host key is new or changed, is tried once and then waits until you refresh, connect yourself or change its login, so a fail2ban jail is not triggered.
- Statuses are honest about age. A status gets worse only after Change after checks in a row over a limit (2 at first) and better at the first check back within limits. A reading older than three check intervals is Can’t check, never shown as live. Defaults: CPU and RAM warn at 70% and are critical at 85%, disk 80% and 90%, latency 150 and 400 ms.
- Prometheus instead. Under Data source you can read
node_exporterfigures from your own Prometheus server; its URL and sign-in stay on this device, with secrets in the system’s secure storage. Plainhttp://with a sign-in is allowed only to addresses on your own network. - What is stored where. Readings, thresholds and alert choices stay on this device and do not sync. Nothing about your servers is sent to ZestSSH.
If something goes wrong
Section titled “If something goes wrong”- No saved login (Add a key). Background checks cannot ask for a password or passphrase. Save the key’s passphrase, or give the host a key.
- Host key changed or New host key (Review the key). Open a terminal to the host once and check its key; monitoring resumes after.
- Sign-in refused or Can’t reach it. Fix the login or the address, then press Try again or Refresh all.
- Over the free plan’s limit. The free plan watches 5 hosts: stop watching one, or upgrade to Squeezed.
- Some metrics show N/A. The monitor reads Linux and macOS; other systems may report only some figures, and the Status cell says which.
Related guides
Section titled “Related guides”- Alerts, for patterns in what a terminal prints
- Hosts and connecting
- Keys
- Networks and jump hosts